All topics › Year 10 Standard
Year 10 Standard Statistics escape room
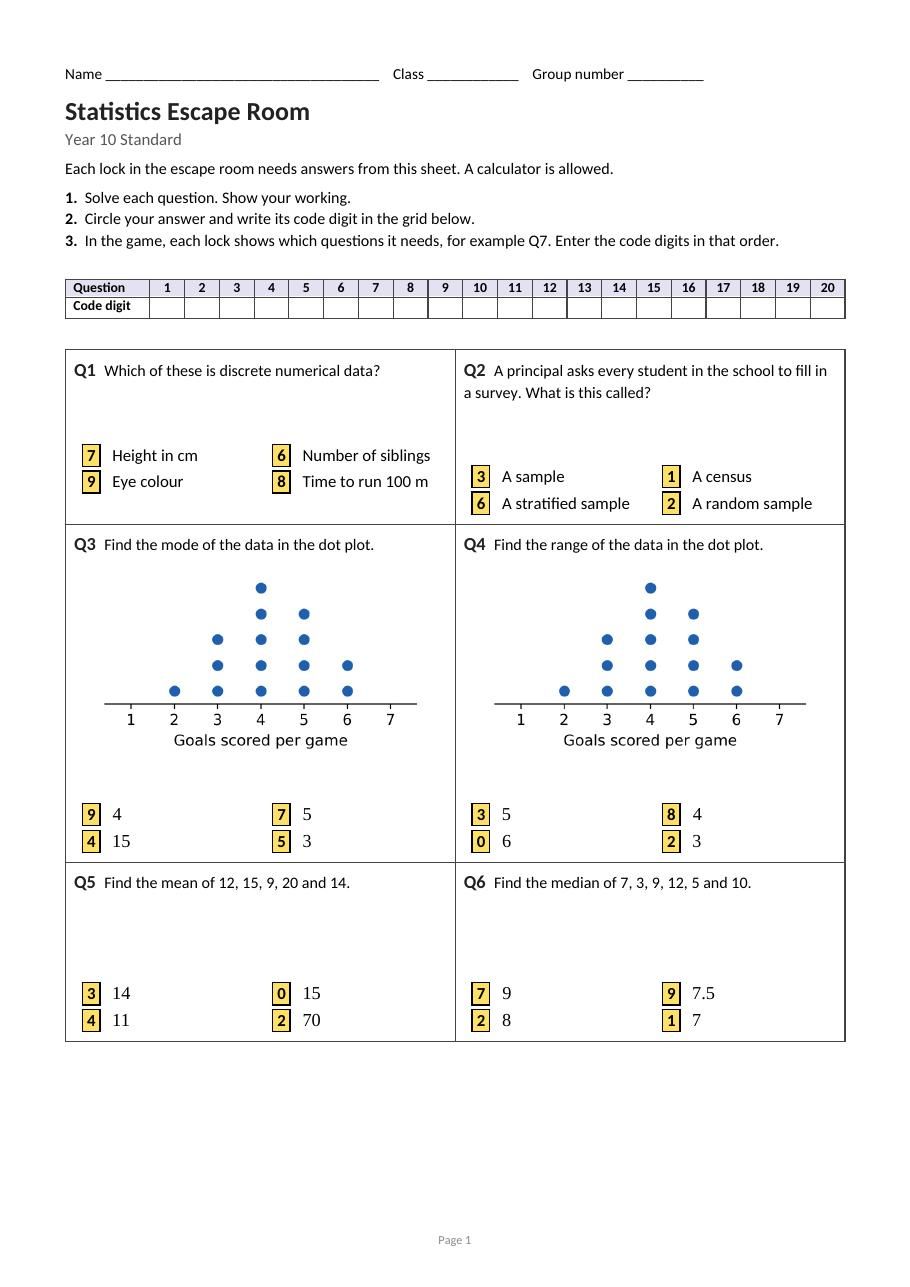
Students solve a 20 question worksheet, then use their answers to open the locks in the game. Groups of 2 or 3, one lesson. A calculator is needed.
What it covers
Types of data, dot plots and stem-and-leaf plots, measures of centre and spread, quartiles, outliers and box plots, standard deviation, scatter plots and lines of best fit. Easy to harder.
| Curriculum | Level | Outcomes |
|---|---|---|
| Australian Curriculum v9 | Year 10 | AC9M10ST02, AC9M10ST03 |
| NSW Mathematics K–10 | Year 10 | MA5-DAT-C-01, MA5-DAT-C-02 |
What you get
- A student worksheet. Each answer gives a code digit for the locks.
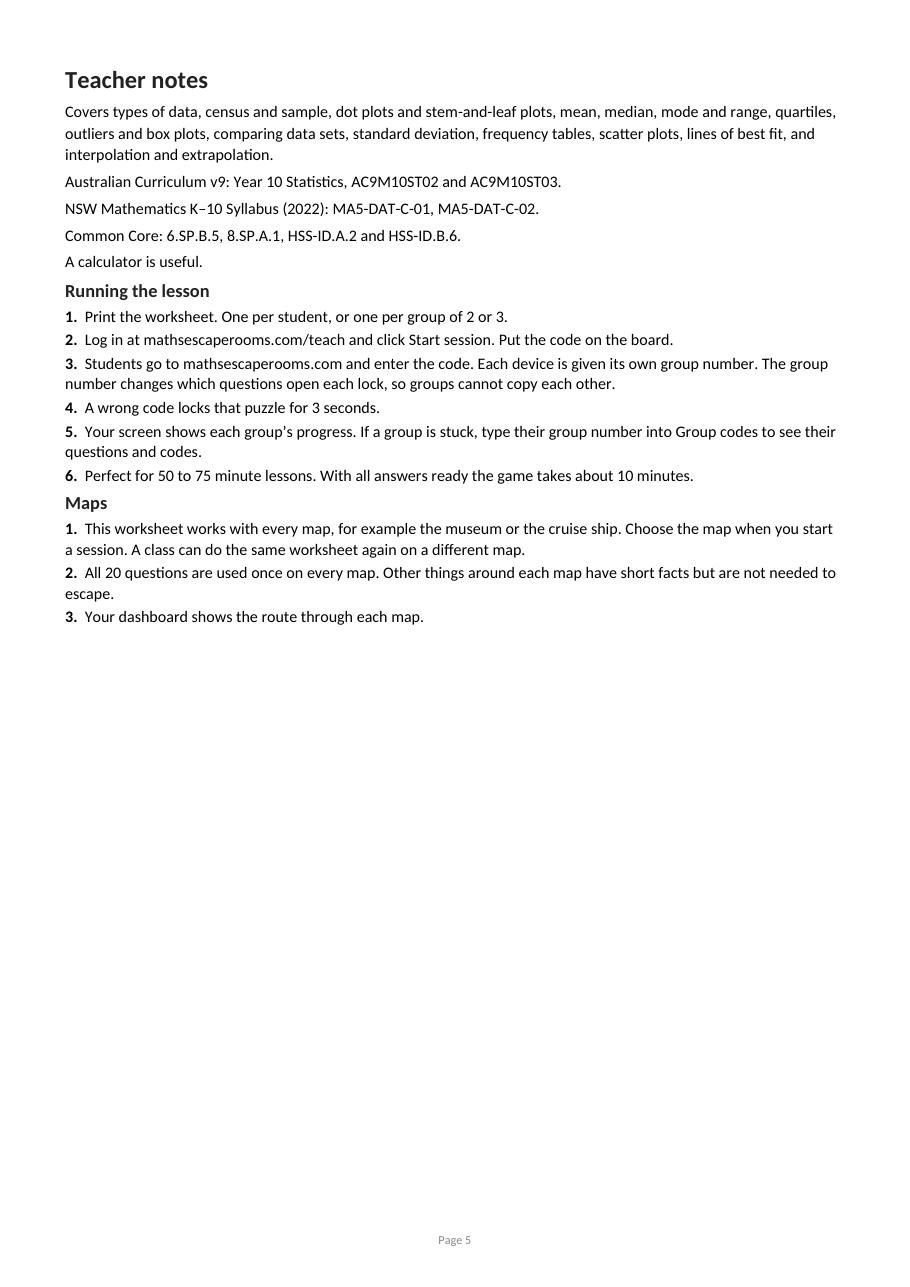
- An answer key with worked solutions to every question, and teacher notes.
- The escape room itself. It plays on every map, and it's self-marking: a wrong code just doesn't open.
- Live progress for every group on your screen.
Sample pages
Buy this topic Try a free topic Play the demo
Teaching in the US? See Grade 8 Statistics and data.